- Applications
- Tools
Math Function
Images


Introduction
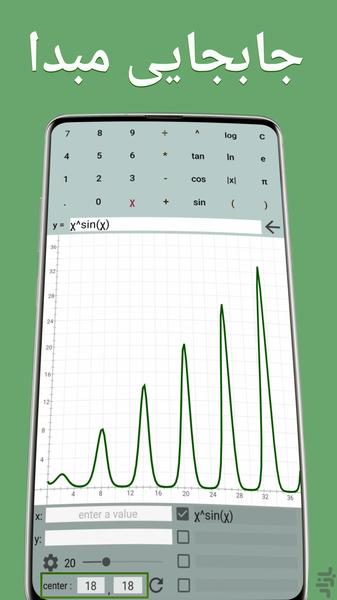
graph mathematical functions and compute equations like a calculator.
○ Prepare your formula by buttons at the top app section and then touch the graphic section.
○ enter a value for x, result is calculated and will be shown.
○ Units number of the chart section is changeable. By default, it is set to 20. Enter a value between 5 to 80. For more details and accuracy try small numbers but for more result to view enter great numbers, after editing the unit's number.
○ There are four slots at bottom app section that keep formulas for further usage.
○ for full screen, touch the chart or rotate your device to landscape mode.
you can change color of the graph and themes as you wish in the setting and there are more things to do.
Once the formula confirmed and drawn; It's possible to enter a value instead of x variable, the result is computed and if the position of calculated point is inside of drawing boundary, it would appear
Axes are displaceable.

